
What Share of the Shelf Price Does Your FOB Cost Still Represent?

Most brands know exactly what it costs to produce a unit. Far fewer know what share of the final shelf price that cost will represent in a new market. That ratio is where product strength meets commercial reality.
Product-centric thinking assumes that a strong product, a willing distributor and genuine consumer demand add up to an opportunity. Value chain thinking asks a harder question: after the product has passed through every participant and authority between the factory gate and the shelf, is the price the consumer sees still competitive? A brand can have all three assumed ingredients and still fail, because the implied shelf price is too high against established local alternatives.
FOB cost is an input, not a price. The consumer price is built by every participant and authority between factory and shelf. A competitive cost base does not, on its own, predict a competitive shelf price.
FOB as a percentage of retail is the viability test. At 35–45% the chain is healthy, at 25–35% it is acceptable, and below 25% it requires review before any contract is signed. Demand and distributor interest cannot substitute for this check.
Negotiate with the whole chain visible. Distributor margin, duty (including any FTA rate) and channel structure are separate levers. Modelling them together, before the distributor’s proposal is accepted, is what keeps strategic flexibility in the brand’s hands.
A new market does not simply receive a product. It reconfigures what the product costs, who handles it and what the consumer finally pays. Between the brand’s FOB cost and the shelf sit freight and insurance, import duty, a local cost stack, a distributor, a retailer or platform, and local consumer tax. Each is a point where value is either carried forward or absorbed.
This is what separates Value Chain Analysis from supply-chain management. The question is not how efficiently goods move. It is how the price is formed along the way, who takes what share of it, and whether what remains at the shelf is competitive against established local alternatives. A brand can create genuine consumer value and still lose it in the structure of the chain. Seeing that structure per SKU and per market, before commitments are made, is the purpose of the analysis.
The strongest mistake is judging a market entry by the distributor’s number. The distributor’s sell-in price is the figure most visible in negotiation, so it becomes the figure under discussion. But it is an intermediate point in the chain. The retail margin, the consumer tax and any platform or channel alternatives sit beyond it, and the duty and local cost stack sit before it.
A brand that negotiates only the sell-in price can agree a margin that looks reasonable and still produce a shelf price that cannot compete. By then the margin is in a contract.
Value chain structure shows up in execution in several concrete ways. Cost structure is built from duty, which depends on the HS code and on whether an FTA applies, and from warehousing, local freight and registration costs. One-off costs such as product registration must be amortised over the first year’s expected volume, so early volume assumptions influence unit economics.
Margin distribution follows from channel choice. The offline channel carries distributor and retail margins. The online channel replaces them with platform fees and last-mile fulfilment costs. For most brands online margin is higher, but volume is lower in the early stages, so the more attractive margin may not be the faster route to scale.
Partner dependence is real but not inherently negative. Relying on a distributor determines how much of the consumer price the brand can influence. What matters is that the dependence is understood and priced before it is accepted.
A disciplined analysis follows a clear progression run per SKU in each of your identified priority markets.
Map - Confirm FOB cost per SKU and gather the inputs: freight per unit, duty rate, distributor and retail margins, local tax. Identify the offline and online structures.
Understand - Build CIF, apply duty, add the local cost stack to reach total delivered cost.
Assess - Apply the distribution layer for the offline channel, or platform and fulfilment costs for the online channel, and compare the resulting consumer prices.
Identify dependencies - Establish which assumptions the result rests on: the distributor’s margin, the duty rate and any FTA, the chosen channel.
Identify value capture - Show how much of the consumer price each participant and authority takes, and what share remains as FOB cost.
Determine strategic implications - Read the FOB-to-retail ratio against the benchmark, then decide whether to proceed, renegotiate, seek a lower duty rate or change channel structure.
This illustrative scenario below highlights this in practice: one SKU, a $12.00 FOB cost, 12% duty, a $1.80 freight and insurance cost, a $1.20 local cost stack, a 40% retail margin and 9% GST. These are example inputs, not market data.
Two brands sell this same SKU. Brand A accepts the distributor’s 38% margin as proposed. Brand B models the chain first and tests two levers: a negotiated distributor margin of 33%, and a lower duty rate under an FTA. The 0% duty case is shown because the framework identifies it as possible.
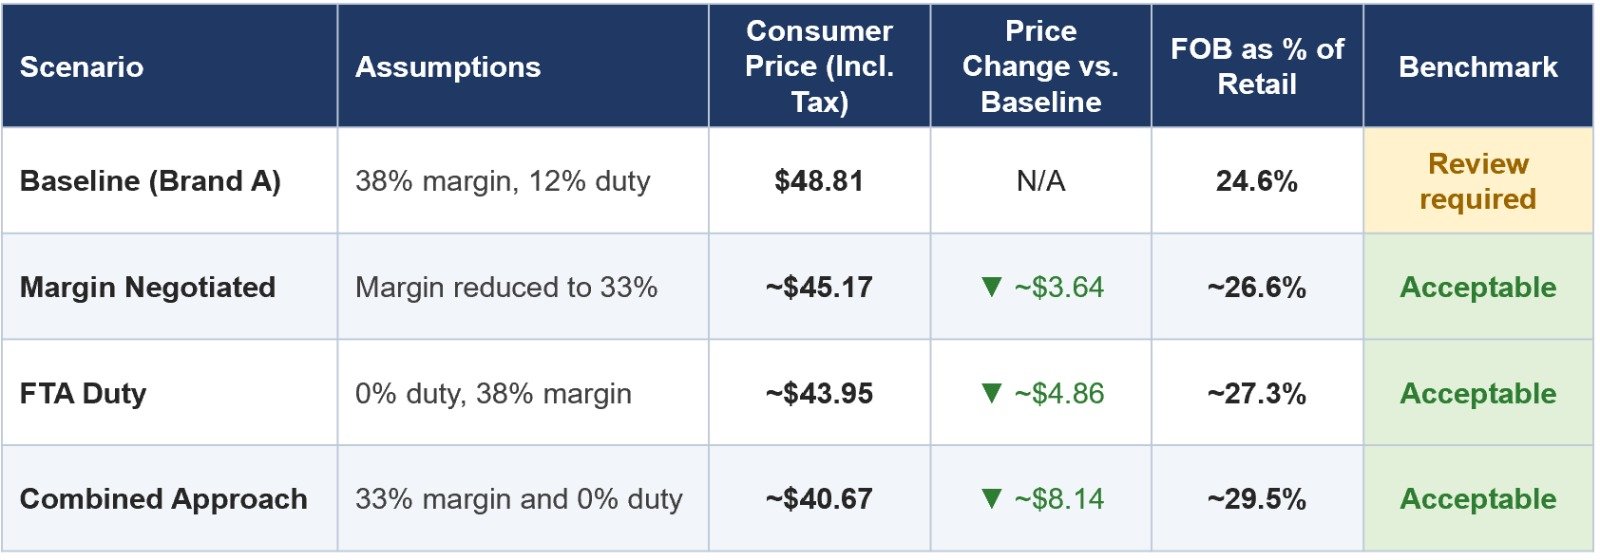
The product, the demand and the distributor are the same in every row. The commercial outcome differs because Brand B understood which parts of the chain could be influenced, and acted before signing.
Map the full cost path for each lead SKU in each of your identified priority markets,from confirmed FOB cost to consumer price including tax, before engaging a distributor on terms.
Identify whether an FTA exists between your manufacturing country and the target market, and check the tariff schedule or WTO tariff database rather than accepting an assumed rate.
Compare offline and online channels for every market. Prioritise the channel that gives the more competitive consumer price at a viable brand margin.
Validate the distributor and retail margin assumptions with prospective distributors, since the framework treats them as standard assumptions to be confirmed, not facts.
Challenge any proposed margin by running it through the model first, so the discussion starts from its effect on consumer price and the FOB-to-retail ratio.
Reconfigure when the ratio falls below 25%: improve FOB efficiency, renegotiate distributor margin or change the channel structure. Hold the contract until it is resolved.
Samana Insight's Framework 08, Value Chain Analysis (Industry Operator Edition), is a step-by-step calculation model that traces a product from manufacturer cost to consumer shelf price in each target market. It is written for commercial managers, strategy analysts and trade managers, and its prerequisite is a confirmed FOB or ex-works cost per SKU. Its output is a retail price model with a margin waterfall.
A product does not move through a market by itself. It moves through freight, duty, distributors, retailers and platforms, each taking its share before the consumer pays. The strategic question is not simply how to sell the product. It is whether you understand the system through which value must move before the product reaches the customer.
Explore the complete Value Chain Analysis Framework, Industry Operator Edition, to see how tracing FOB cost through freight, duty, local costs, distributor and retail margins, and consumer tax, per SKU and per market, brings greater discipline to international expansion decisions, and how Framework 09, P&L Outlook, carries the same logic into commercial planning.
